
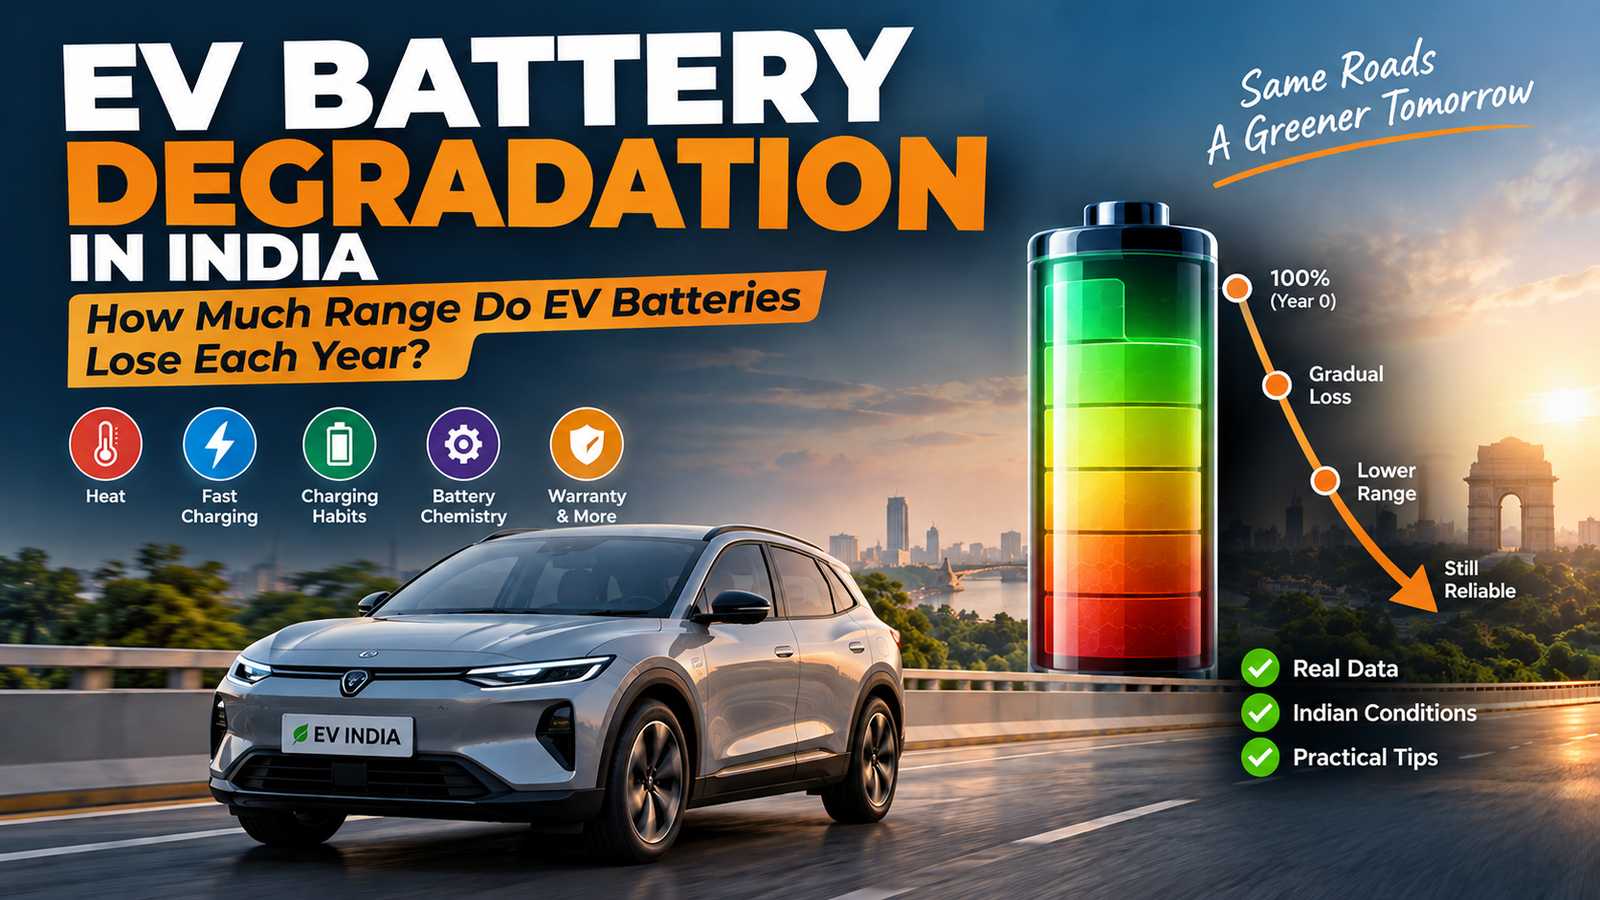
EV Battery Degradation in India: How Much Range Do EV Batteries Lose Each Year?
Every prospective EV buyer in India eventually asks some version of the same question: will the battery still be good in five years, or will I be staring at a lakh-rupee replacement bill? It’s a fair worry, and also one of the most misunderstood topics in Indian EV ownership. EV battery degradation in India gets discussed constantly on owner forums and WhatsApp groups, usually with numbers nobody can actually source. This piece tries to do better — it draws on large-scale fleet telematics studies, Indian manufacturer warranty documents, and published battery research to answer the question as honestly as the data allows: there is no single number, but there is a well-understood range, and a clear set of factors that push individual cars toward the better or worse end of it.
What Is EV Battery Degradation?
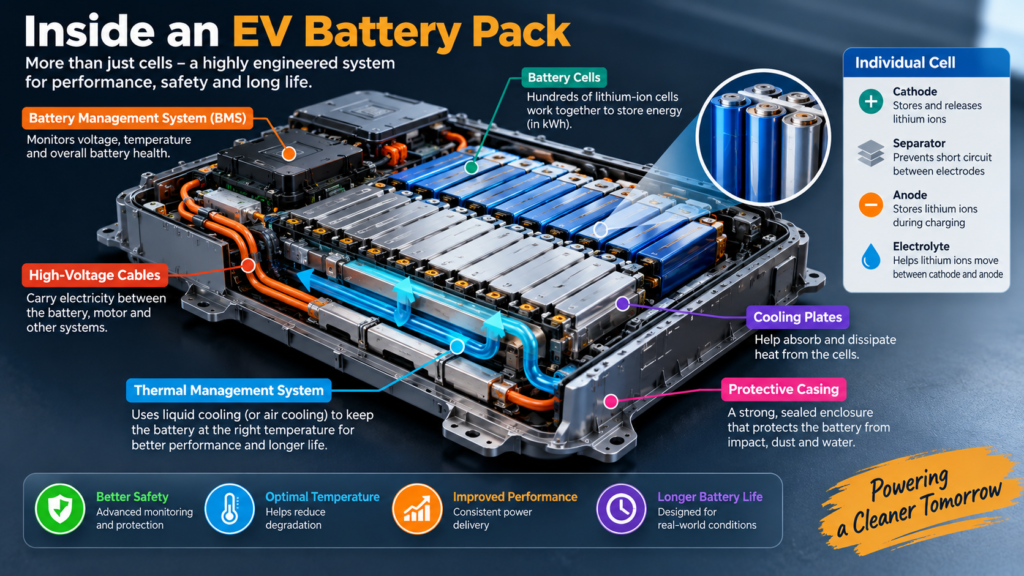
An EV battery pack is built from hundreds of individual lithium-ion cells. Every time those cells go through a charge-discharge cycle, and every day they simply sit at a given temperature and charge level, tiny chemical side-reactions occur inside them. These reactions slowly consume the lithium and electrode material that the battery needs to store energy, and they also build up internal resistance. The practical result is that the pack’s usable capacity — measured in kWh — gradually shrinks, and it can also deliver power slightly less efficiently over time.
This capacity loss is usually expressed as State of Health (SOH), a percentage comparing the battery’s current usable capacity to its capacity when new. A battery at 90% SOH can hold 90% of the energy it could when it left the factory. This is different from State of Charge (SOC), which is simply how full the battery is right now — the number on your dashboard between 0 and 100%.
Degradation is gradual, permanent (it can’t be “reset” by driving differently), and expected. Every lithium-ion battery — in a phone, a laptop, or an EV — degrades over time. The real question for owners isn’t whether it happens, but how fast, and what actually influences that speed.
How EV Battery Degradation Affects Driving Range
There’s a direct link between battery capacity and range: fewer usable kWh means fewer kilometres per charge, all else being equal. But this is exactly where most owner anxiety goes wrong. A change in the number on the dashboard is not proof that the battery has degraded.
Displayed range is an estimate, calculated by the car’s software using recent driving efficiency, current battery temperature, and remaining SOC. It moves around constantly for reasons that have nothing to do with permanent capacity loss — see the table later in this article. Genuine degradation only becomes measurable when you compare like-for-like: the same route, similar weather, a full charge, over a period of months, not days.
How Much Battery Degradation Happens Each Year?
This is the section every reader wants a single clean number for — and the honest answer is that no such universal number exists. Degradation rates depend on the vehicle, the battery chemistry, the thermal management design, the climate the car operates in, and above all, how it’s charged and used. What research does give us is a realistic range of outcomes from large, real-world datasets.
The most rigorous and recent of these comes from Geotab, a fleet telematics company that has been publishing EV battery studies since 2020. Its most recent analysis (2026) examined 22,700 electric vehicles across 21 make-models, using real telematics data rather than lab tests, and found an average annual degradation rate of 2.3%, projecting to roughly 81.6% of original capacity after eight years at that average rate. Geotab’s own study history shows this figure has moved before: 2.3%/year in its 2020 study, an improved 1.8%/year in its 2023 analysis of 11 established models (credited to better thermal management), and back to 2.3% in 2026 as high-power DC fast charging became more common across the newer vehicles in the dataset. Crucially, Geotab attributes the 2026 uptick to charging behaviour and a newer vehicle mix, not to batteries getting worse — eight of the eleven original 2023 models had actually stabilised to an average of just 1.4% per year by 2026.
A separate whitepaper from P3 Group, a European battery-testing and engineering firm, analysed data from more than 7,000 electric vehicles, including many with over 200,000 km on the odometer, and found that most batteries retained more than 80% of original capacity even at that high-mileage mark — evidence that real-world aging is slower than the fear-driven narrative around EV batteries suggests. US-based battery-data firm Recurrent, which tracks over 30,000 EVs in its community (and more than 50,000 vehicles and 1.1 billion miles on its current platform), separately reported that 68% of model-year 2023 EVs still meet or exceed their original EPA-estimated range, and that outright battery replacement is rare — a 0.3% replacement rate among 2022-and-newer model years.
None of these studies were conducted on Indian fleets, and Indian ambient temperatures, road conditions, and charging infrastructure differ from the US, European, and mixed-climate samples they’re drawn from. They are cited here because they are the largest, most methodologically transparent EV battery datasets publicly available, and because the mechanisms they document — heat, fast-charging power, charge-cycle intensity, state-of-charge exposure — apply to any lithium-ion pack regardless of where it’s driven. Treat the specific percentages as context for how modern EV batteries behave in aggregate, not as a forecast for any one Indian-market car.
Calendar Aging vs Cycle Aging
Two separate aging mechanisms run simultaneously inside every EV battery, and understanding both explains why two EVs of the same age can have very different battery health.
Calendar aging is degradation that happens purely because time has passed — chemical side-reactions inside the cells continue slowly even when the car is parked and never driven. It’s accelerated by heat and by spending long periods at very high or very low charge.
Cycle aging is degradation tied to actual energy throughput — how much the battery is charged and discharged, and how hard (fast charging pushes more current through the cells in less time, generating more heat and stress).
| Type | Main Driver | Example | Typical Owner Scenario |
|---|---|---|---|
| Calendar aging | Time, temperature, resting state of charge | A battery left at 100% in Delhi summer heat for weeks | A second car that’s driven rarely but parked outdoors year-round |
| Cycle aging | Charge/discharge throughput, charging speed | Repeated deep 10%–100% cycles, frequent DC fast charging | A high-mileage cab or delivery EV charged mostly on public DC chargers |
A low-mileage EV that’s rarely driven isn’t automatically “fresh” — calendar aging keeps working regardless. Conversely, a high-mileage EV charged mostly on gentle home AC power can end up with less cycle-related wear than a low-mileage one that fast-charges constantly.
What Causes EV Battery Degradation?
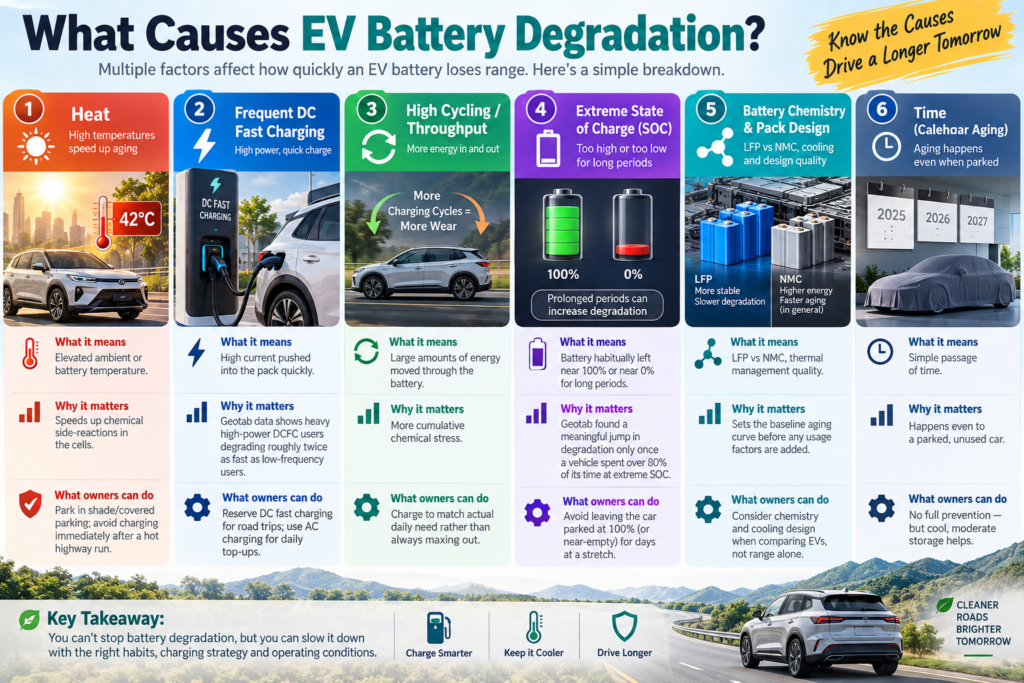
| Cause | What It Means | Why It Matters | What Owners Can Do |
|---|---|---|---|
| Heat | Elevated ambient or battery temperature | Speeds up chemical side-reactions in the cells | Park in shade/covered parking; avoid charging immediately after a hot highway run |
| Frequent/high-power DC fast charging | High current pushed into the pack quickly | Geotab data shows heavy high-power DCFC users degrading roughly twice as fast as low-frequency users | Reserve DC fast charging for road trips; use AC charging for daily top-ups |
| High cycling/throughput | Large amounts of energy moved through the battery | More cumulative chemical stress | Charge to match actual daily need rather than always maxing out |
| Prolonged extreme state of charge | Battery habitually left near 100% or near 0% for long periods | Geotab found a meaningful jump in degradation only once a vehicle spent over 80% of its time at extreme SOC | Avoid leaving the car parked at 100% (or near-empty) for days at a stretch |
| Battery chemistry & pack design | LFP vs NMC, thermal management quality | Sets the baseline aging curve before any usage factors are added | Consider chemistry and cooling design when comparing EVs, not range alone |
| Time (calendar aging) | Simple passage of time | Happens even to a parked, unused car | No full prevention — but cool, moderate storage helps |
Does Fast Charging Degrade an EV Battery Faster?
The relationship is real but conditional, not absolute. AC (alternating current) home or workplace charging is slow and generates minimal heat. DC (direct current) fast charging pushes much higher current into the pack directly, which produces more heat and places more stress on the cells — but modern EVs use a Battery Management System (BMS) that actively limits charging current, cools or preconditions the battery, and tapers charging speed (especially above roughly 80% SOC) specifically to manage this stress.
Geotab’s fleet data quantifies the difference clearly: vehicles that used DC fast charging for less than 12% of their charging sessions averaged 1.5% degradation per year, while vehicles that used it more than 12% of the time averaged 2.5%. Splitting the high-frequency group further, those using mostly sub-100kW fast charging averaged 2.2%, while those frequently using charging above 100kW averaged 3.0% — nearly double the low-frequency group. The takeaway isn’t “never fast charge” — it’s that fast charging as your default, everyday method (rather than an occasional convenience) measurably increases wear over years of use. Occasional fast charging on a highway trip is a different pattern entirely from relying on it daily because home charging isn’t set up.
Does Charging an EV to 100% Damage the Battery?
Not in any dramatic, immediate sense — but manufacturer guidance generally still recommends restraint for daily use. Most EVs (India included) let owners set a charge limit in the infotainment system, commonly suggested around 80–90% for everyday charging, reserving 100% for days when the full range is actually needed, such as a long trip.
Geotab’s SOC analysis found that moderate exposure to high or low charge levels made almost no measurable difference to degradation (1.4% vs 1.5% annual rate between low and medium exposure groups) — this is partly because EVs build in a software buffer, so a dashboard reading of 100% isn’t actually a chemically full cell. Degradation only accelerated meaningfully once a vehicle spent more than 80% of its total time parked at extreme charge levels. In plain terms: charging to 100% occasionally, or even regularly, isn’t the problem — routinely leaving the car sitting at 100% (or near-empty) for long, habitual stretches is what the data flags. Always defer to your specific manufacturer’s owner manual and app guidance, since BMS calibration differs between models.
Does Deep Discharging Reduce Battery Life?
“Deep discharge” refers to running the battery down to a very low state of charge. Modern EV battery-management systems maintain a protective floor well above true zero — the car will typically limit power, warn the driver, and eventually stop well before the cells reach a genuinely harmful low voltage. Occasionally reaching a low indicated charge level (say, driving to 5–10% before charging) is normal operation and not, by itself, harmful.
What can matter more is habitually parking the vehicle for long periods at a very low charge, particularly in heat — this combines calendar aging with low-SOC stress. As with the 100% question, the BMS is specifically engineered to prevent the kind of true over-discharge that would meaningfully damage cells during ordinary use.
How Indian Heat Affects EV Battery Degradation
India’s climate is genuinely one of the more demanding environments for any lithium-ion battery — but the effect should be understood precisely, not exaggerated. Geotab’s data, grouping vehicles by the share of days above 25°C, found hot-climate vehicles degraded 0.4% faster per year on average than those in milder climates. That’s a real, measurable penalty, but a modest one relative to the swings caused by charging behaviour (1.5% to 3.0% depending on fast-charging habits).
Four separate things get conflated when people talk about “Indian heat destroying batteries,” and it’s worth pulling them apart:
- Ambient temperature — the air temperature outside, which can exceed 45°C in parts of north and central India in summer.
- Battery temperature — what the cells themselves actually experience, moderated (often substantially) by the vehicle’s thermal management system, whether liquid-cooled or passive.
- Time spent at high state of charge in heat — the combination that stresses cells most, e.g., a car parked outdoors at 100% SOC for days during a heatwave.
- Charging heat — the additional, temporary heat generated during DC fast charging, which compounds ambient heat if a car fast-charges in the middle of a hot afternoon.
A liquid-cooled battery pack actively regulates cell temperature regardless of whether it’s 20°C or 45°C outside, which is precisely why manufacturers building for the Indian market increasingly specify active thermal management. Southern Indian coastal cities and hill regions see different heat-and-humidity profiles than the Indo-Gangetic plain, but no published large-scale study isolates Indian regional variation specifically — this remains a genuine data gap, and readers should treat regional comparisons as reasonable inference rather than measured fact. Sensible, non-alarmist practice — shaded or covered parking where possible, avoiding leaving the car at 100% SOC through peak summer heat, and not routinely fast-charging in the hottest part of the day — addresses the mechanisms the data actually supports, without requiring dramatic changes to ownership habits.
LFP vs NMC: Which Battery Chemistry Ages Differently?
Indian EVs use two dominant lithium-ion chemistries, and the difference matters for degradation behaviour, though it’s far from the only factor.
LFP (Lithium Iron Phosphate) cells use an iron-phosphate cathode. They’re known for strong thermal stability, tolerance of frequent full charging, and comparatively long cycle life, at the cost of somewhat lower energy density (more weight/volume needed for the same range) and reduced performance in very cold conditions — a minor concern for most of India. Tata’s 45kWh battery pack (used in the Nexon EV and Curvv EV) uses LFP prismatic cells, and MG’s Windsor EV uses an LFP “Blade” pack.
NMC (Nickel Manganese Cobalt) cells offer higher energy density — more range for a given pack size and weight — but are generally considered somewhat more sensitive to being routinely charged to 100% and to high heat, and typically call for more conservative charging habits to maximise longevity. The Hyundai Creta Electric uses an NMC pack.
| Factor | LFP | NMC | What It Means for EV Owners |
|---|---|---|---|
| Thermal stability | Higher | Lower (relatively) | LFP packs are generally more tolerant of Indian summer heat |
| Energy density | Lower | Higher | NMC packs can offer more range in a similarly sized/weighted pack |
| Tolerance for 100% charging | Higher | Lower (relatively) | LFP owners can charge to full more routinely without as much concern |
| Typical cycle life | Longer | Shorter (relatively) | LFP may show a flatter long-term degradation curve |
| Cold-weather performance | Weaker | Stronger | Rarely a practical issue across most of India |
| Manufacturer examples in India | Tata Nexon/Curvv 45kWh, MG Windsor | Hyundai Creta Electric | Chemistry is one input among many — pack design and BMS still dominate outcomes |
Neither chemistry is universally “better.” A well-engineered NMC pack with strong thermal management can outperform a poorly managed LFP pack, and vice versa. The complete system — cells, cooling, and the software managing both — determines real-world degradation far more than chemistry alone.
Does High Mileage Mean Faster EV Battery Degradation?
Mileage correlates with cycle aging (more driving generally means more charge cycles), but it isn’t destiny. A high-mileage EV charged mostly at home on gentle AC power, driven efficiently, and not habitually parked at extreme states of charge, can retain more capacity than a low-mileage EV that’s mostly fast-charged in the sun. Geotab’s utilisation analysis found that going from low daily throughput to high daily throughput added roughly 0.8 percentage points to the annual degradation rate (from around 1.5% to 2.3%) — a real but moderate effect, and notably smaller than the swing caused purely by fast-charging habits. Odometer reading, in other words, is a weak standalone predictor of battery health; charging history and pattern matter more.
EV Battery Warranty: What Does the Manufacturer Actually Guarantee?
There’s no government-mandated, industry-wide EV battery warranty standard in India (unlike the United States, where federal rules require a minimum 8-year/100,000-mile warranty with a 70% capacity floor under 40 CFR 86.1815-27). Every Indian manufacturer sets its own terms, and it’s important to distinguish a warranty (a promise to repair or replace under defined conditions) from a capacity-retention guarantee (an explicit promise about how much range/capacity remains after X years) — many Indian warranties cover manufacturing defects and malfunction, not a specific guaranteed SOH percentage.
As of the current Indian EV market, published warranty terms include (always confirm current terms directly with the dealer/manufacturer before purchase, as these are frequently revised):
| Manufacturer / Model | Standard Vehicle Warranty | Battery & Motor Warranty | Extended Options |
|---|---|---|---|
| Tata Nexon EV / Curvv EV (45 kWh) | 3 yrs / 1,25,000 km | Lifetime (unlimited km) for first owner on the 45kWh pack; 8 yrs / 1,60,000 km otherwise | Up to 6 yrs / 1,60,000 km paid extension |
| Tata Punch EV | 3 yrs / 1,25,000 km | Lifetime (first owner) / 8 yrs / 1,60,000 km | Up to 5 yrs / 1,25,000 km |
| Hyundai Creta Electric | 3 yrs / unlimited km | 8 yrs / 1,60,000 km | Up to 5 yrs / 1,40,000 km |
| MG Windsor EV | 3 yrs / unlimited km | Lifetime warranty for first private owner | e-Shield packages up to 5 yrs, unlimited km |
| BYD Atto 3 / eMAX 7 | 6 yrs / 1,50,000 km | 8 yrs / 1,60,000 km | Extended powertrain packages available |
| Mahindra BE 6 | Standard vehicle terms | Lifetime warranty for original first private owner | Coverage may not transfer on resale |
A few important caveats: “lifetime” warranties are generally tied to the first private owner only and typically don’t transfer on resale, which matters a great deal for used-EV buyers. Terms, exact kilometre caps, and whether a specific capacity-retention floor is stated all vary by manufacturer and can change between model years — none of this substitutes for reading your own vehicle’s actual warranty booklet.
How to Check the Battery Health of a Used EV
A used EV’s odometer reading alone tells you almost nothing about its actual battery condition — charging history and past climate exposure matter more. Before buying, insist on:
| Check | Why It Matters |
|---|---|
| Manufacturer/dealer battery-health (SOH) diagnostic scan | Gives an actual measured capacity figure rather than a guess from range alone |
| Full service history | Reveals whether the battery has already needed attention |
| Warranty status and transferability | “Lifetime” battery warranties frequently don’t transfer to a second owner |
| Battery replacement history | A replaced pack may be newer than the car itself — get this in writing |
| Charging history (where available via app/telematics) | Heavy habitual DC fast-charging use is a meaningful risk signal |
| Vehicle age vs mileage pattern | High mileage/young age suggests cycle-aging dominance; low mileage/older age suggests calendar aging dominance |
| Test-drive range vs claimed range, in similar conditions | A rough sanity check — not a substitute for a proper SOH scan |
| Unusual or sudden range-loss complaints from the seller | A red flag worth investigating with a proper diagnostic, not dismissing |
A single mileage figure is never sufficient on its own — two EVs with identical odometer readings can have meaningfully different battery health depending entirely on how each was charged and stored.
How Indian EV Owners Can Reduce Unnecessary Battery Wear
None of this requires anxious, obsessive management — just a handful of sensible habits grounded in what the data actually shows matters:
- Use home/workplace AC charging as your default; treat DC fast charging as an occasional convenience for longer trips, not a daily routine.
- Set a daily charge limit (commonly 80–90%, per your manufacturer’s guidance) rather than always charging to 100%.
- Avoid leaving the car parked at 100% SOC (or near-empty) for extended periods, especially during peak summer heat.
- Park in shade or covered parking where available, particularly for cars that spend the day sitting in a hot parking lot.
- Follow your specific manufacturer’s owner manual — chemistry and BMS design differ enough between models that a rule that’s ideal for one EV may be unnecessary for another.
What Battery Degradation Should EV Owners Actually Worry About?
Based on the fleet data reviewed here, a gradual, low-single-digit-percentage annual capacity loss — broadly in the 1.5–3% per year range depending heavily on charging habits and climate — is consistent with what large studies observe as normal for a well-maintained EV. What should prompt a proper diagnostic check with your dealer or an authorised service centre is a sudden or sharp drop in usable range that isn’t explained by weather, driving style, or a software update; repeated warning messages about battery health; or a noticeably worse fast-charging speed than when the car was new. Gradual, predictable decline over years is the expected pattern — a sudden cliff is not, and deserves investigation rather than assumption.
Final Takeaway
EV battery degradation in India isn’t a mystery, but it also isn’t reducible to one number you can quote with confidence. What large-scale fleet data consistently shows is that modern EV batteries are built to substantially outlast the vehicles around them, that charging behaviour (particularly reliance on high-power DC fast charging) matters more than almost anything else an owner controls, and that Indian heat is a real but modest factor next to that. For buyers — new or used — the practical move isn’t to fear a specific annual percentage, but to understand the manufacturer’s actual warranty terms, ask for a real SOH reading on any used EV, and adopt the same handful of sensible charging habits that the data, not internet folklore, actually supports.
FAQs
How much does an EV battery degrade each year?
There’s no single universal figure, but large fleet studies offer a useful range. Geotab’s 2026 analysis of 22,700 EVs found an average of 2.3% capacity loss per year, while charging habits alone shifted individual vehicles between roughly 1.5% and 3.0% annually. Your actual rate depends heavily on charging behaviour, climate, and battery chemistry.
How long does an EV battery last in India?
Most EV battery packs are engineered to outlast the vehicle’s usable service life, per large-scale fleet data, though no India-specific large study exists yet. Indian manufacturers back this with 8-year warranties or lifetime coverage for first owners on several current models, reflecting confidence that packs remain usable well beyond a decade of normal use.
Does fast charging reduce EV battery life?
Frequent, high-power DC fast charging does measurably increase wear compared to gentle AC charging — Geotab’s data shows roughly double the annual degradation rate for heavy high-power fast-charging users versus low-frequency users. Occasional fast charging on trips is different from relying on it as your everyday charging method.
Is charging an EV to 100% bad for the battery?
Occasional or even routine charging to 100% isn’t, by itself, strongly damaging, according to fleet data — moderate exposure to high charge levels showed minimal impact. What matters more is habitually leaving a vehicle parked at 100% (or near-empty) for long, extended periods, especially in heat.
How can I check EV battery health?
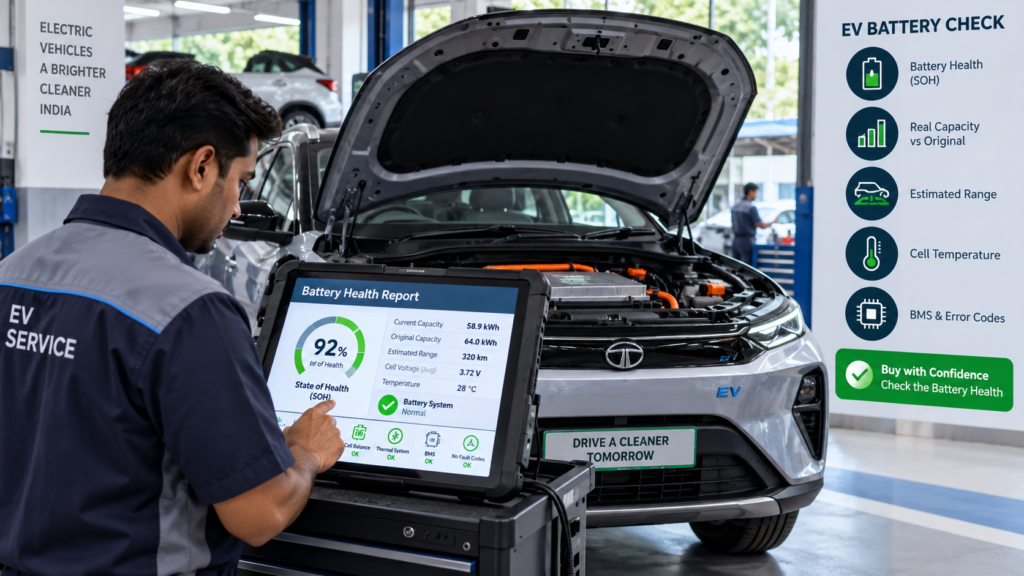
The most reliable method is a manufacturer or dealer diagnostic scan that reports actual State of Health (SOH), not just displayed range. For a used EV, also request service history, charging history where available, warranty transferability, and any battery replacement records before relying on mileage alone.
Battery degradation and warranty coverage are closely connected. If you want to understand what manufacturers actually cover, including battery capacity limits, warranty periods and important conditions, read our detailed guide: EV Battery Warranty Explained: What’s Actually Covered?